Understand the bill
See current-cycle cost, projected bill, monthly trends, and the usage behind them.
 Talk to my energy
Your meter, made legible
A private Chrome side panel for Southern California Edison interval usage, solar exports, bills, and time-of-use insights.
One year, one clear view
Sign in to your SCE account, sync, and explore the information available to you without uploading it to a developer-operated server.
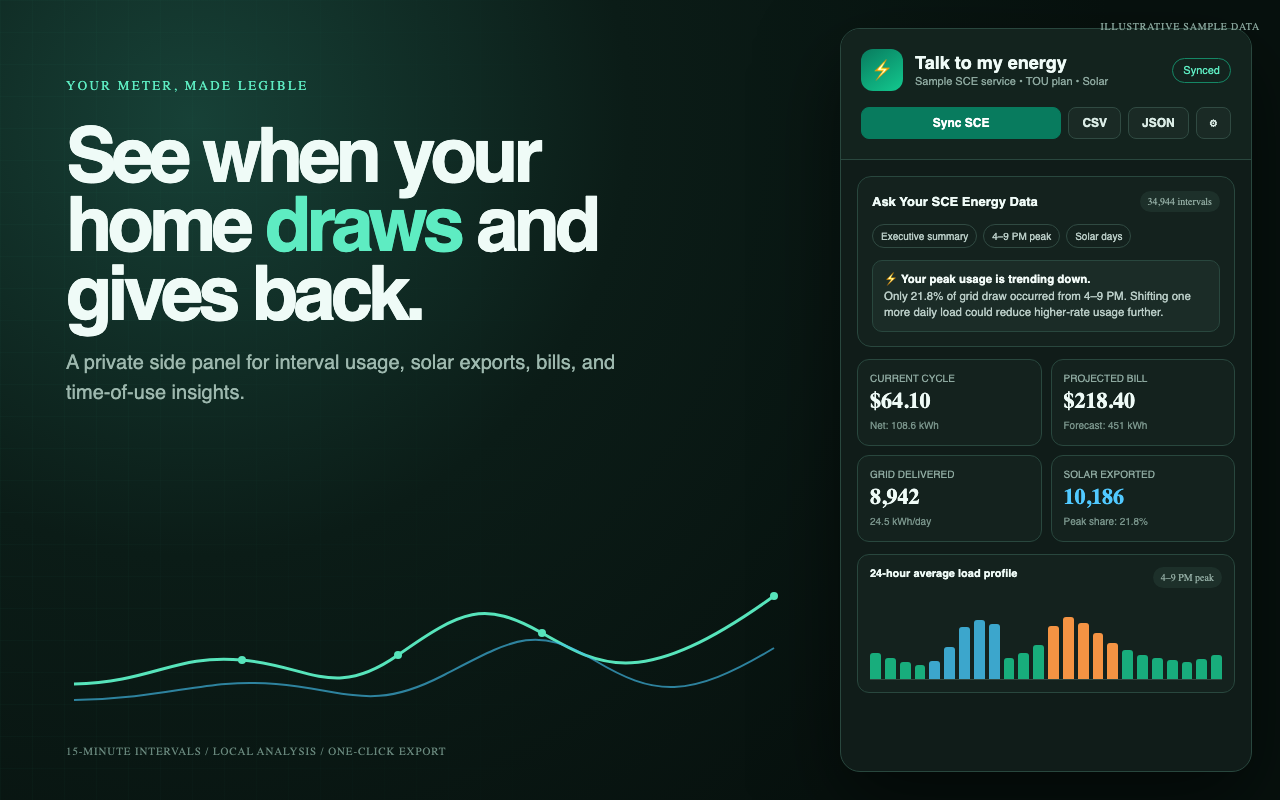
Illustrative sample data
See current-cycle cost, projected bill, monthly trends, and the usage behind them.
Compare your daily load curve with time-of-use windows and identify loads worth shifting.
Separate energy delivered by the grid from solar exported back to it across days and hours.
Get deterministic, on-device answers about peak share, high-usage days, exports, and trends.
Private by architecture
The extension reads information available in your signed-in SCE account and stores the synced dashboard data in Chrome's local extension storage.
There is no developer-operated data server, advertising network, analytics tracker, or remote AI service in the public release.
Read the full privacy policy →Less guessing. Better timing.
Chrome Web Store release is being prepared now.